With proper care, this phantom will withstand years of normal use. Below are some guidelines to follow.
Scan Surface: The scanning surface is the most important item on the phantom to protect. It can withstand normal scanning pressure but DO NOT press on the scanning surface with your fingernails or any other sharp objects. If the scanning surface becomes damaged, seal the phantom in an airtight container and IMMEDIATELY contact CIRS for return authorization. Call 800-617-1177, email at [email protected] or fax RMA Request form to 757-857-0523.
Cleaning: The phantom may be cleaned with mild soap and water ONLY. Avoid solvent- based, alcohol-based, or abrasive cleaning agents. For longest life, the phantom should be cleaned after each use.
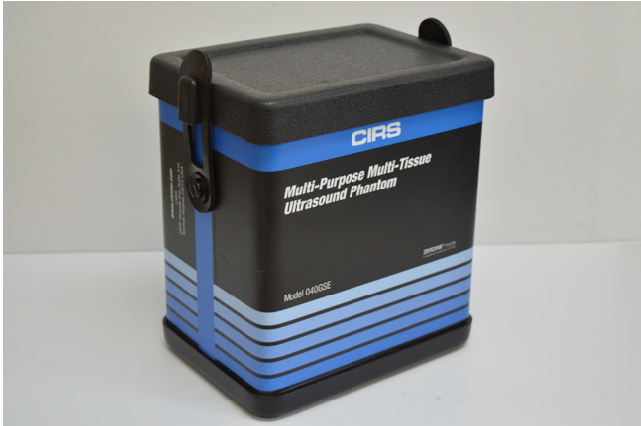
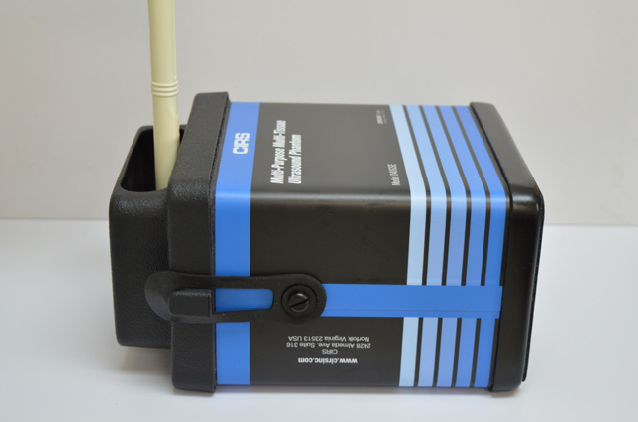
![]() Storage: Store at room temperature in the provided carry case. The primary concern is gel desiccation due to loss of water vapor through the membrane. In addition, the thermal stresses associated with the freeze/thaw cycle may cause the gel to crack or damage the housing integrity, while extreme heat may accelerate water vapor transmission through the membrane. To minimize desiccation, always store the phantom in the air-tight carry case with the removable storage cover attached.
Storage: Store at room temperature in the provided carry case. The primary concern is gel desiccation due to loss of water vapor through the membrane. In addition, the thermal stresses associated with the freeze/thaw cycle may cause the gel to crack or damage the housing integrity, while extreme heat may accelerate water vapor transmission through the membrane. To minimize desiccation, always store the phantom in the air-tight carry case with the removable storage cover attached.
![]() Maintenance: At least once a year, weigh your phantom and compare to original weight noted on certificate of compliance. If the phantom has lost or gained more than 1% of its original weight and you notice a difference in vertical distance measurements, or if the scan surface appears depressed, call CIRS at (800) 617-1177.
Maintenance: At least once a year, weigh your phantom and compare to original weight noted on certificate of compliance. If the phantom has lost or gained more than 1% of its original weight and you notice a difference in vertical distance measurements, or if the scan surface appears depressed, call CIRS at (800) 617-1177.
![]() Material Safety: This product contains Zerdine, a non-flowing water-based, polyacrylamide material which is fully sealed within the phantom housing. Zerdine contains trace amounts of the residual monomer acrylamide CAS#79-06-1. There are no known hazards when the phantom is used and stored as intended. Zerdine is fully cured and will not leak from the housing. Damage to the integrity of the housing may expose the user to trace amounts of acrylamide monomer. The amount is not sufficient to pose an acute health risk, but it is still advised to wear protective gloves if handling exposed Zerdine gel due to the potential long-term hazards of the monomer. It is also advisable to wash hands and all surfaces with soap and water after handling exposed Zerdine gel. Regulations regarding disposal of materials with trace acrylamide monomer vary by locality. Contact your local authority for instructions. If assistance is desired in the proper disposal of this product, including accessories and components, after its useful life, please return to CIRS.
Material Safety: This product contains Zerdine, a non-flowing water-based, polyacrylamide material which is fully sealed within the phantom housing. Zerdine contains trace amounts of the residual monomer acrylamide CAS#79-06-1. There are no known hazards when the phantom is used and stored as intended. Zerdine is fully cured and will not leak from the housing. Damage to the integrity of the housing may expose the user to trace amounts of acrylamide monomer. The amount is not sufficient to pose an acute health risk, but it is still advised to wear protective gloves if handling exposed Zerdine gel due to the potential long-term hazards of the monomer. It is also advisable to wash hands and all surfaces with soap and water after handling exposed Zerdine gel. Regulations regarding disposal of materials with trace acrylamide monomer vary by locality. Contact your local authority for instructions. If assistance is desired in the proper disposal of this product, including accessories and components, after its useful life, please return to CIRS.

Testing frequency:
ACR: Annual (Semi-annual recommended)
AIUM: Quarterly
AAPM: Daily
IEC TS 62736:2016: Monthly
Background: Inspection of the ultrasound scanner condition, and periodic cleaning and maintenance, is required by all major standards bodies.
Measurement Procedure: Check the following machine components:
- Control panel for dirty or broken switches and knobs, burnt out lights
- Scanner housing for dents and cosmetic damage
- Display is clean and free of scratches
- Wheels allow easy maneuvering of cart & are seated securely; wheel locks are functional
- Power cords & plugs are free of cracks and discoloration
- Dust filters should be clean and free of lint/clumps of dirt
AIUM accreditation standards also recommend the following cleanliness and safety practices:
- Immediately: clean any spill of bodily fluids or hazardous materials
- At the end of each exam: clean gel from ultrasound machine control panels
- Daily:
- Clean monitors and inspect for cracks
- Check for damage to power cords or PACS connections
- ID and report improper operation of switches or knobs on console
- ID and report any burned-out indicators lights
- Clean rooms for dust, dirt and infection control
- Weekly:
- Clean dust from machine console air filters
- Check machine for dents and other damage
- Monthly:
- Thoroughly clean ultrasound machine console and other equipment in the exam room
These routine checks can be added to the QA Portal as part of a separate test lineup, or they may be documented elsewhere and audited during your annual survey.
Testing frequency:
ACR: Annual (Semi-annual recommended)
AIUM: Quarterly
AAPM: Daily
IEC TS 62736:2016: Monthly
Background: Inspection of the ultrasound scanner condition, and periodic cleaning and maintenance, is required by all major standards bodies.
Measurement Procedure:
- Check the transducer surface & housing for cracks, separations, and discolorations
- Check the cable for damage
AIUM accreditation standards also recommend the following cleanliness and safety practices:
- Immediately: clean any spill of bodily fluids or hazardous materials
- At the end of each exam: clean gel from transducers
- Daily:
- Check transducer cables for damage
- Check transducer surface for cracks, separations, or discolorations
These routine checks can be added to the QA Portal as part of a separate test lineup, or they may be documented elsewhere and audited during your annual survey.
Testing frequency:
ACR: Annual (Semi-annual recommended)
AIUM: Quarterly
AAPM: Daily
IEC TS 62736:2016: Monthly
Background: AAPM Ultrasound Task Group 1 report recommends checking scanner display performance by inspecting a suitable greyscale test pattern. If it is possible to load a test pattern to your machine, AIUM recommendations allow assessment using the greybar on the display. Users may also want to consider adding more rigorous luminance measurements to the test protocol. For more information, see the “ACR-AAPM-SIIM Technical Standard for Electronic Practice of Medical Imaging.”
ACR requires testing the display for both the ultrasound scanner (the primary interpretation display) and for secondary displays (such as at a PACS terminal). Secondary display performance is not included in the default settings of the QA Portal, as maintenance of these displays is typically managed by another department. If not, a new test procedure for secondary displays should be added to the QA Portal.
Measurement Procedure:
- Check that the brightness and contrast controls are at their baseline settings
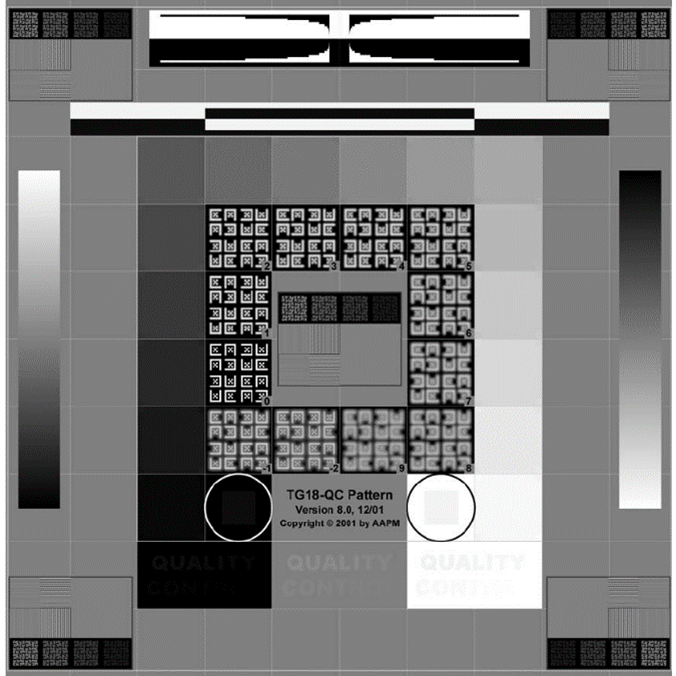
- Pull greyscale test pattern (such as a SMPTE or AAPM TG-18 pattern shown in figures 1-2) and count the number of visible steps.
- Is the alphanumerical information on the display sharp?
- Luminance ratio = Luminance of the brightest grey level divided by luminance of darkest grey level. This requires a luminance meter.
Testing frequency:
ACR: Annual (Semi-annual recommended)
AIUM: Quarterly
AAPM: Annual
IEC TS 62736:2016: Monthly (in-air), Bi-annual (phantom)
Background: Image uniformity tests are performed to ensure that all transducer crystals and associated electronic circuitry are functioning properly. In this test, transducers are rated on the following scale adapted from the AIUM Quality Assurance Manual for Gray Scale Ultrasound Scanners:
- No streaking
- 1-2 minor shadows
- 1 serious shadow or 3+ minor shadows
- Multiple serious shadows
Transducers with a rating of 1 or 2 are still operational, and those with a rating of 3 should be used with caution and replaced when possible. Transducers rated 4 should be immediately removed from service. Any images that show defects should be archived to the PACS system for future reference so that any changes to performance can be noted during future tests. Note that this procedure is designed primarily to detect vertical banding in the image caused by damaged transducer elements or wiring, which is the most common source of failure in ultrasound systems. Horizontal banding, although less common, is another potential source of error. This may be difficult to detect during this procedure due to the limited depth of field; it should also be checked during contrast resolution measurements. Horizontal banding is caused by failures in the system circuitry, focusing or image processing software, and is less common than vertical streaking due to bad transducer elements. As the most common source of system failure, optional semi-annual checks of image uniformity are recommended.
Measurement Procedure:
- Minimize depth of field (about 4 cm) to ensure good spatial detail near the transducer surface
- Place the focus near the transducer surface
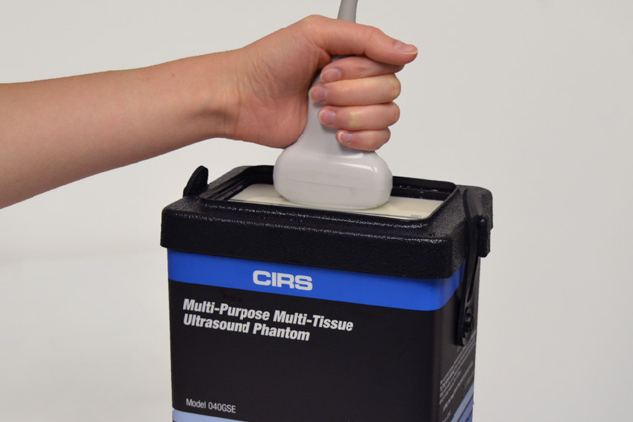
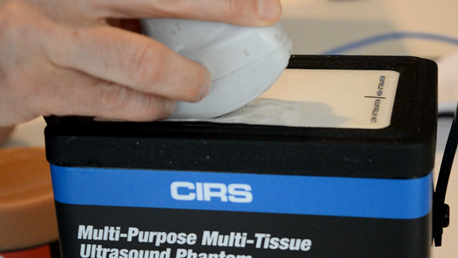
- Apply couplant and place the transducer on the phantom, preferably over a region with as few targets as possible.
- Test transducer as described in the sub-sections below and rate the level of streaking found on the 1-4 scale described previously.
Testing Curved Transducers:
With the transducer properly positioned, slowly rock the transducer side-to-side to ensure all elements are tested. Figure 1 shows an of how to position the transducer, while Figure 2 shows the resulting set of images, extracted from a cine loop.
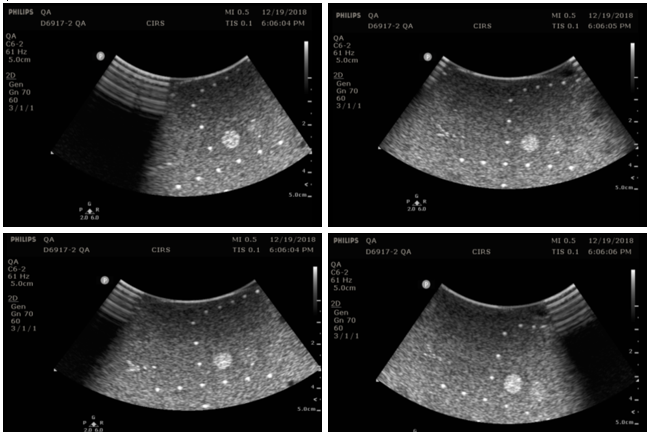
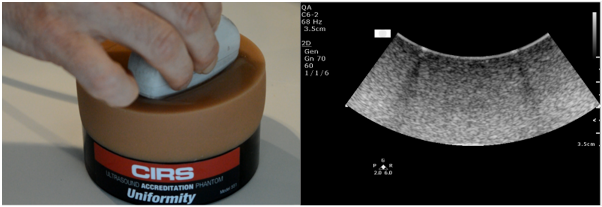
Note that defects due to poor coupling will move as the transducer moves, while vertical streaks due to transducer defects will stay in the same place as the transducer moves. Customers may want to consider purchasing CIRS’s Model 551 Uniformity Phantom as a low-cost tool facilitate uniformity testing. The compliant, uniform material used to make this phantom allows conformal coverage of all transducer elements, making it easier to identify stationary dead elements from coupling artifacts. Figure 3 shows this phantom alongside an image from a transducer with a simulated dead element.
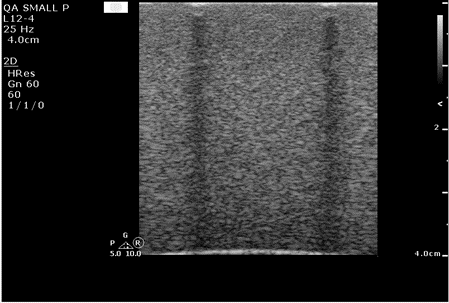
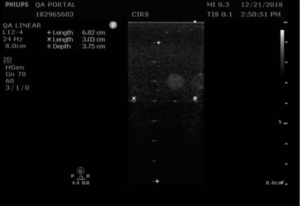
Testing Flat Linear Probe:
Place the imaging array flat on the phantom surface and slide the transducer forward and back to change the background speckle pattern. The speckle should move, while any artifacts will remain stationary. An example image is shown in figure 4.

In figure 5, a defective transducer has been simulated by affixing several wires to the transmitting surface.
Testing frequency:
ACR: Semi-annual recommended
AIUM: Quarterly
AAPM: Annual
IEC TS 62736:2016: Bi-annual
Background: Many ultrasound transducers form 3-D images by mechanically scanning the transducer in the depth, and some low-cost “wobbler” devices form 2-D images by mechanically scanning a single transducer element. These devices require more frequency testing of geometric accuracy in the mechanical scan direction due to the higher potential for mechanical failures/mis-calibration.
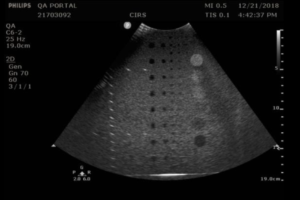
The accuracy of these devices can be tested by scanning the probe in the direction of the horizontal pins.
Measurement Procedure:
- Obtain an image of the horizontal pins, so that the pins appear as a series of dots. For 3D transducers, this may require rotating the probe 90° with respect to the standard imaging plane.
- With calipers, measure the distance between the furthest spaced horizontal pins in the image and note the pins used in the measurement.
- Record measurements on the QA portal. Note: Pin distances may vary from phantom to phantom. Pass/fail decisions should be based on a deviation from baseline, not against the nominal values provided in the phantom specification. The default pass/fail criteria for these measurements were obtained from the AAPM Ultrasound Task Group 1 Report for horizontal pins.
Testing frequency:
ACR: —
AIUM: Quarterly
AAPM: Annual
IEC TS 62736:2016: Biennial
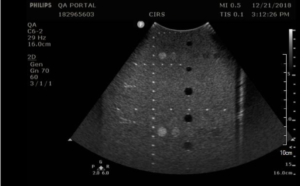
Background: Standard geometric accuracy measurements are made in the vertical and horizontal directions. The most accurate measurements are obtained when the pins are spaced as far apart as possible. The measurement procedure below provides tips for transducer placement to ensure as many pins as possible are placed in the field of view of the transducer. Note that mechanically scanned transducers (as found in some 3D probes and low-cost “wobbler” devices) require more frequent testing in the scan direction due to the potential for failures in the mechanical scanner. A separate test procedure has been written for these transducers.
Measurement Procedure:
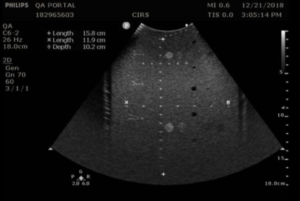
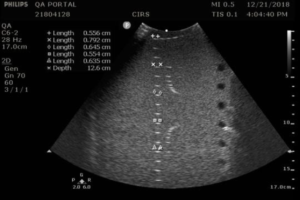
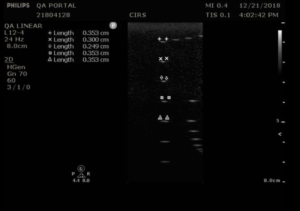
- Obtain an image of the vertical and horizontal pins. Adjust the depth of field to obtain an image with as many pins as possible. You may need to position the vertical pins slightly off-center to get as many horizontal pins as possible in the image. Figures 1 and 2 provide examples for an abdominal probe and a small parts probe.
- With calipers, measure distance between the 1st pin and last visible vertical pin
- With calipers, measure the distance between the furthest spaced horizontal pins in the image
- Record measurements on the QA portal. Note: Pin distances may vary from phantom to phantom. Pass/fail decisions should be based on a deviation from baseline, not against the nominal values provided in the phantom specification. The default pass/fail criteria for these measurements were obtained from the AAPM Ultrasound Task Group 1 Report.
Testing frequency:
ACR: Annual
AIUM: Quarterly
AAPM: Annual
IEC TS 62736:2016: Biennial
Background: System sensitivity is measured by determining how deep in a phantom echo signals from background scatterers can be detected on the display. For this reason, the test is often called the maximum depth of penetration or the maximum depth of visualization. Sensitivity measurements, because they provide an important measurement of system performance, are recommended as part of the annual survey, in compliance with ACR Ultrasound Accreditation Requirements and the recommendations of the AIUM. AAPM recommends more frequent quarterly testing of sensitivity.
Measurement Procedure:
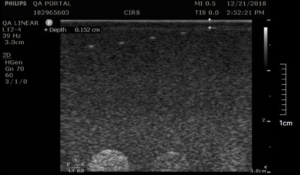
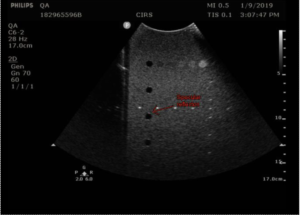
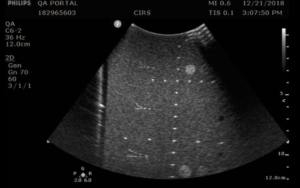
To measure depth of penetration, users look for the depth where the brightness of stationary speckle matches the brightness of the moving electronic noise. Best results are obtained when the transducer is positioned over a column of anechoic targets, as only electronic noise will be visible within the anechoic targets. Other adjustments from the general system settings may be needed, as follows:
- Depth of field: Adjust the depth setting high enough to ensure that the maximum depth of penetration is visible. For abdominal probes, this should be approximately 20 cm, while for small parts probes a depth of approximately 6-8 cm is needed.
- Focal depth: The focus should be in the region where the speckle signal matches the noise signal. Note that this will be a moving target, as the speckle brightness will increase as the focus is moved deeper.
- Gain: With some probes, the maximum depth of penetration may be greater than the depth of the phantom at a standard gain setting. In that case, lower the gain until the maximum depth of penetration is within the depth of the phantom.
After adjusting the settings, follow these steps:
- Eyeball the position where the speckle and noise brightness matches
- Use electronic calipers to measure the distance between the transducer surface and this position, as in figure 1.
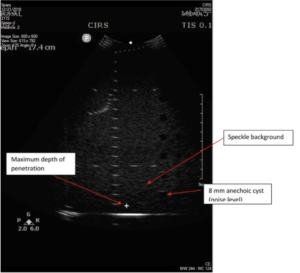
Note that many users are tempted to measure the position of the last visible wire target in the vertical target group, but wire targets are considerably brighter than the speckle texture, and therefore are not a sensitive indicator of transducer performance.
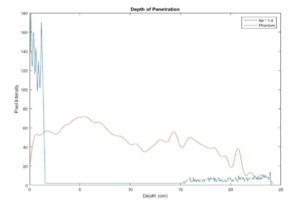
A common objection to the method recommended above is that “eyeballing” the intersection between noise and speckle is subjective and therefore prone to error. For a more quantitative measurement, the maximum depth of penetration can be measured using a number of image analysis programs such as ImageJ or MatLab. To do so, a phantom image and an image taken while the transducer is in air (and cleaned of all coupling fluid) are needed. Next, measure the median speckle brightness as a function of depth in both images, you can find the intersection of the speckle brightness against the noise floor. In many systems, the noise floor is quite low, and it is not possible to find this intersection. In that case, you may consider multiplying the noise floor by a factor of 1.4. An example plot from this measurement, is shown in figure 2 below. In this example, the depth of penetration is 24 cm.
The default pass/fail criteria for depth of penetration measurements was obtained from the AAPM Ultrasound Task Group 1 Report, with a variance of 0.6 cm from baseline indicating a monitoring condition, while a variance of 1 cm indicating a failure. Those wishing to loosen the criteria may wish to conduct a study to determine measurement variance associated with “eyeballing” the depth of penetration value. A high measurement variance may be used to justify a looser pass/fail criteria.
Testing frequency:
ACR: Annual is recommended
AIUM: Quarterly
AAPM: Annual
IEC TS 62736:2016: Biennial
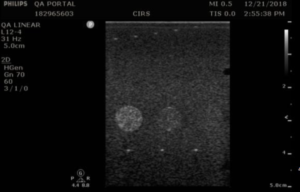
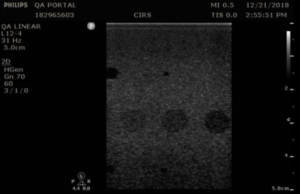
Background: Contrast resolution, sometimes referred to as functional resolution or low-contrast detectability, is a test of an imaging system’s ability to detect and display the size, shape, and depth of dark, or anechoic, target structures. This test indicates the smallest diameter target a system can resolve at a given depth.
When performing this test, anechoic targets should appear circular with sharp, clearly defined edges, and be free of any observable shading (echo fill-in). Possible sources of echo fill-in include poor resolution (which causes speckle from the echogenic background to spread out into the anechoic target), internal system noise, the presence of side lobes in the ultrasound beam, and defects in the image processing architecture. Figure 1 provides a good example of echo fill-in.
When imaging anechoic targets, bright echoes may be observed at the top and bottom of anechoic targets, as shown in figure 2. These echoes are normal specular reflections and do not present a problem.
Contrast resolution testing also provides a good opportunity to check for horizontal banding in the image, a uniformity artifact caused by problems with the system software or electronic circuitry. While this problem is rare, horizontal banding can be missed in the Image Uniformity & Artifact Survey due to the limited depth of field used in that procedure.
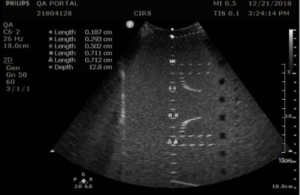
Measurement Procedure: Contrast resolution measurements in the 54GS are performed by measuring the diameter of the 8 mm anechoic cylinders at each depth they are visible. The closer the match to 8 mm, the better the contrast resolution.
- Position the transducer over the anechoic target structures until a clear image is obtained.
- Freeze the image and measure the width of all visible targets, as shown in figures 3-4
- Record measurements in QA portal.
- Unfreeze the image and continue scanning to check for geometric distortions and areas of non-uniformity, particularly horizontal banding. If any artifacts are detected, repeat the scan at a different location to rule out a defect in that region of the phantom. If the artifacts are still present, repeat the scan using a different gain and focal setting. Be sure to save images of any artifacts found. Finally, document your findings in the “Distortion Assessment” field of the QA portal and make a pass/fail decision based on the clinical significance of the finding. This may require consultation with the system manufacturer and the physician in charge.
Testing frequency:
ACR: Annual is recommended
AIUM: Annual
AAPM: —
IEC TS 62736:2016: Biennial
Background: Axial resolution measures how close two objects can be in the depth direction of the ultrasound beam while still being detected as two distinct objects. Axial resolution is proportional to the length of the system’s transmitted ultrasonic pulse or pulse length. Lateral resolution is like axial resolution, except in the width direction.
Lateral resolution will improve with a narrowing beam width, with the lowest value found at the beam focus.
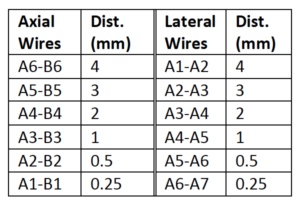
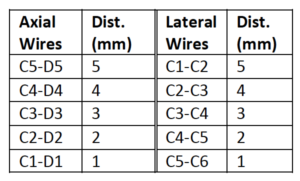
The Model 054GS has two combined axial and lateral resolution target groups. The first group, found at a depth of 3 cm, consists of 6 axial and lateral wire pairs, spaced 4, 3, 2, 1, 0.5 and 0.25 mm apart (figure 1).
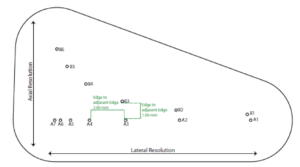
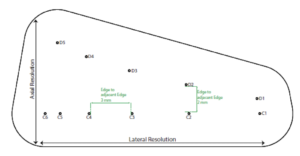
The second group is located at a depth of 11 cm and consists of 11 parallel nylon wires of 80 microns diameter spaced 5 mm, 4 mm, 3 mm, 2 mm and 1 mm apart (figure 2).
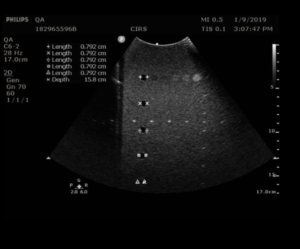
Measurement Procedure:
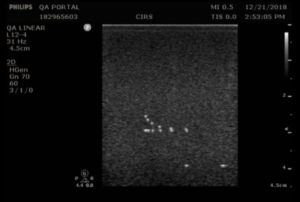
- Apply couplant and position the transducer above the axial resolution targets in a vertical plane.(The wires should appear as dots, not lines).
- Align the probe so that all the targets are displayed at their maximum intensity level and adjust the focus to match the depth of the targets assessed. The image should appear as in figures 3-4 below
- Freeze and save the image
- Determine the last pair of axial wire targets to be distinguished as two separate entities and record the value
- Determine the last pair of lateral wire targets to be distinguished as two separate entities and record the value
Testing frequency:
ACR: Annual is recommended
AIUM: Annual
AAPM: —
IEC TS 62736:2016: Biennial
Background: Elevational resolution is defined as the ability of an ultrasound system to resolve closely spaced objects along the thickness direction of the ultrasound transducer. For this reason, elevational resolution is often called slice thickness. Slice thickness is typically much coarser than axial and lateral resolution as most ultrasound transducer arrays are mechanically focused in the thickness dimensions.
Elevational resolution can be assessed by rotating the transducer 45° with respect to the vertical wire targets, as described first by Skolnick1. Note that this measurement also contains information about lateral resolution, due to the 45° transducer rotation, and therefore provides an estimate of elevational resolution only.
Measurement Procedure:
- Apply couplant and orient the transducer to obtain an image with the vertical target wires in the center. Be sure to adjust the tilt of the transducer so that the wires are lined up in a vertical column.
- Rotate the transducer 45°, being careful to keep the tilt of the transducer so that the wires are still lined up in a vertical column. A 45° angle may be eyeballed or, for more precision, the horizontal wires may be used a guide to judge the angle of rotation. The distance between horizontal pins will increase by a factor of 1.4 when the transducer is rotated 45°.
- Adjust the focus to match the depth of the pin with the smallest width, so that the transmit/receive focus matches the fixed elevational focus.
- Freeze the image and measure the length of key wire segments with the electronic calibers, as in figures 1-2. The most important wire to include in this set is the smallest wire segment, the depth of which defines the elevational focus of the transducer.
- Save the image and record the measurements.
1 Skolnick, ML. “Estimation of ultrasound beam width in the elevation (section thickness) plane.” Radiology. 1991 Jul;180(1):286-8.
Testing frequency:
ACR: —
AIUM: —
AAPM: —
IEC TS 62736:2016: —
Background: Beam profile measurements (sometimes called focal zone or lateral response measurements) are used to assess the shape of the ultrasound beam, a key factor in determining system resolution. The narrowest region within the beam profile occurs at the focal point. This is also the region where beam intensity is greatest and the image brightness is at its peak.
Measurement Procedure:
- Position the transducer so that the vertical wire targets are at the center of the image.
- Adjust the focus as desired and freeze the image
- Measure the width of five key wires in the column with the electronic calipers and save the image
- If performing the measurement as part of acceptance testing, record the wires measured and the focal depth on the QA portal.
- Record the width of each wire measured.
Testing frequency:
ACR: —
AIUM: —
AAPM: —
IEC TS 62736:2016: —
Background: To create greyscale images in B-mode ultrasound, the ultrasound scanner converts the amplitude of echoes received by the transducer to brightness values on the display. The range from a just noticeable echo at the lowest grey level to the maximum echo brightness at the highest is referred to as the displayed dynamic range or greyscale contrast sensitivity.
In the Model 054GS, greyscale contrast is evaluated using a set of five cylindrical targets, 8 mm in diameter, at a depth of 4 cm. The targets have the following greyscale contrast levels relative to the background: –6 dB, -3 dB, +3dB, +6 dB and hyperechoic (approximately +9 dB). The default measurement procedure below describes a method for qualitative evaluation of greyscale contrast.
Alternatively, IEC Standard 61391-2, section 7.2.4,1 describes a quantitative method for estimating local dynamic range. This method requires off-line analysis of the digital image to measure the mean pixel intensity within the ROI of each greyscale target. This intensity is then plotted against contrast level in dB, and a linear regression is performed to obtain the equation of the line of best fit, y = mx + b. This equation is then used to obtain the echo contrast level x for y = 1 (minimum greyscale intensity) and y = 255 (maximum intensity). The difference between these two values is the local dynamic range.
Measurement Procedure:
- Apply couplant and position the transducer above the greyscale targets so that the targets appear as a circular region as in figures 1-3
- Freeze and save the image
- Note which targets are clearly visible & record readings. Use the notes to comment on the appearance of the lesion, particularly those that are noticeably distorted (not circular) or blurry.
1 IEC 61391-2:2010 : Ultrasonics – Pulse-echo scanners – Part 2: Measurement of maximum depth of penetration and local dynamic range. Section 7.2.4, “Estimating local dynamic range using backscatter contrast.”
Targets should have a clear progression in brightness from low to high based on the contrast levels.
Testing frequency:
ACR: —
AIUM: Annual
AAPM: —
IEC TS 62736:2016: —
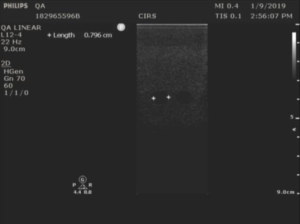
Background: The near field group of wire targets is used to assess the distance from the front face of the transducer to the closest identifiable echo. This region is commonly referred to as the “dead zone” or “ring-down distance,” as this region it is characterized by one or more bright echo lines that block out the image. Modern ultrasound systems have a very small dead zone, and as result this measurement would typically be performed only during acceptance testing.
Measurement Procedure:
- Obtain an image of the near field targets as shown in figure 1. (This image is from the 054GS. The number of pins visible will vary depending on the phantom used.)
- With the electronic calipers, measure the distance from the transducer face to the closest resolvable wire target.
- Record the distance. Note that the actual dead zone is smaller than this distance. (The closest pin, by virtue of being visible, is outside the dead zone.)